- cuag
- Contents
- 1. Introduction
- 2. Getting prepared
- 3. Initial set up
- 4. Advanced configuration
- 5. The user interface
- 6. Organising your data
- 7. Common workflows
- 8. Contributions
- 9. Pledges
-
10.
Events
- 10.1. What is CiviEvent?
- 10.2. Event planning and management
- 10.3. Creating an event
- 10.4. Online event registration
- 10.5. Integrating events with your website
- 10.6. Manual event registration
- 10.7. Keeping track of events and participants
- 10.8. Complex event fees
- 10.9. Event templates
- 10.10. Reports
- 10.11. Custom data for events
- 10.12. Repeating Events
-
11.
Membership
- 11.1. What is CiviMember
- 11.2. Defining memberships
- 11.3. Online membership sign up
- 11.4. Manual entry of memberships
- 11.5. Membership price sets
- 11.6. Finding and viewing memberships
- 11.7. Membership Reports
- 11.8. Renewals
- 11.9. Cancelling and expiring memberships
- 11.10. Making member only websites
- 12. Email
- 13. SMS (text messaging)
- 14. Reporting
- 15. Case management
- 16. Campaign
- 17. Survey
- 18. Petition
- 19. Civic Engagement
- 20. Grants
- 21. Website integration
- 22. The CiviCRM Community
- 23. Appendices
Set-up
This section explains how to set up CiviReports. It assumes a basic understanding of why you would want to use CiviReport, and describes the workflow for creating a report from a template through to making these reports available for users. It also assumes that the report you require can be achieved using the report templates supplied with CiviCRM.
If the report template you need does not exist you (or your developer) should refer to the Custom Reports chapter in the Extensions section of the Developer Guide for information about creating new templates.
Report templates
Report templates are general reports that can be further customised to create specific report instances. These report instances can then be made available to users.
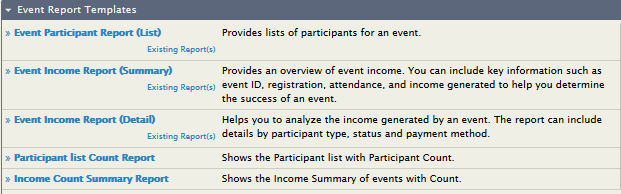
The Create new report from templates page lists all available report templates and is found in the Administer > CiviReport menu. The templates are grouped by component, and each has a brief description of its intended scenario. If there are already report instances for a given template, you'll see a link to view Existing Reports.
Clicking on the report template name will bring up a screen where the report can be configured.
There are two steps to configuring a report:
- Select your report criteria: decide what information will be displayed in the report.
- Define the report settings: choose a title, set permissions and add it to a menu.
Select report criteria
When you create a new report you will be presented with two or more tabs that will let you define the information the will be displayed in your report. The tabs available will depend on the template you have selected with the most common being:
- Columns (all reports)
- Grouping (summary reports)
- Sorting (detail reports)
- Filters(all reports)
The options available for these criteria change from report to report. General principles for the different types of report criteria are outlined below.
Columns
These check boxes allow you to select the data to be displayed for each record in your report. In most reports, at least one display column is required and cannot be unselected. For example in the membership detail report Contact Name and Membership Type are required fileds
 Grouping
This is not available in all reports, but it is useful when creating a report which summarises data, rather than displaying each individual row, and for reports that compare different types of data.
For example you can choose to compare donations per year.


You can specify more than one grouping criteria. When you do this, results will be nested based on both groupings. Not all combinations of groupings will make sense for your data. You may need to spend time experimenting with Group By Columns to become familiar with this functionality.
Note that some Groups By Columns interact with Display Columns and can't be selected at the same time. The system will warn you if you try to make an invalid selection.
Sorting
This is not available in all reports, but can be useful in "detail" reports as shown below.


Filters
Filters are the main way to specify the records that you want to include in the report. For example, running the Membership Detail report without choosing any filters will show you all membership records. You could then filter the report to show all members of a specific membership type who joined last year. Most filter are self-explanatory; the date range filter is explained below.
The Date Range Filter
Most reports will have a date range filter. This can be configured in two ways:
- by using an absolute date range, e.g. "1st Jan 2010" to "31 July 2010"
- by using a relative date range, e.g. "Previous Year".

Relative date ranges are very useful for reports that you want to run on an ongoing basis for example:
- This year gives all records from the start of the current year.
- Previous quarter gives all records from the previous quarter.
- Last 12 months gives all records between one year earlier than today's date, and today (really useful!).
The "Last ..." ranges are particularly useful when used in combination with Group By Columns. Combining Ending Year with Group By Month gives a report that summarises data by month for the previous 12 months.
The report below shows the total amount of contributions received in the past 12 months, as well as each month's total.

Once you have selected your report criteria, click Preview Report. (You will see that the tabs that define the report settings are now visible.) If the information displayed isn't exactly what you wanted, you can select the appropriate tab to modify your criteria. You may need to make several modifications before you achieve the report you want.
Define Report settings
Once you are happy with the report criteria you have entered into the template, you need to save this criteria as a new report so that it can be run again. To do this:
- On the Title and Format tab give your report a title and
description that will help other people understand its usage, for
example, "Student members joined so far this year". A standard
header and footer is included with each report and is displayed at
the beginning and end of any PDF or downloaded versions of the
report. These are written in HTML. If you want to display the
actual report title replace "CiviCRM Report"in the
tag. You can include a logo be adding an <img>tag. You can also modify the look and feel of the printed report by including a custom CSS file (instead of print.css)

- The Email Deliverytab contains the fields that will let you have
report emailed to yourself or someone else on a regular basis. Fill
in the Subject, To and CC fields in the Email Delivery Settings. You
can enter one or more email addresses in the To and CC fields;
multiple email addresses should be separated by commas. See the
information below about Email settings to ensure your reports are
sent.

On the Access tab, you can set if and where the report will appear in the menu. All reports will be included in Report > Report listing. Check Include Report in Navigation Menu? and specify the parent menu to include the report in another menu. For example, you might want to add an Event report to the Event menu.

On the Access tab, you can also set up permissions to view or edit reports on a report-by-report basis. This allows you to simplify the user interface for junior users and set sensitive reports to be accessible only to certain users. For example, you might select "access CiviContribute" for contribution reports so that only the people that can see contribution data can access the report.
Alternatively you can limit access to a report to (a) particular ACL role(s). Refer to the Permissions and Access Control in the Initial Set Up chapter.
A Reserved Report can only be altered by someone with the Administer Reserved Reports permission.
Checking the box Available for Dashboard? lets users with appropriate permissions to add this report to their dashboard (this is done by clicking the Configure Your Dashboard button on the individual's dashboard).
Click Create Report. The report will now appear in Reports > All Reports as well as in any navigation menu you defined on the Access tab.
Email settings
As well as entering the email delivery settings described above, the Mail Reports (mail_report) scheduled job must be enabled to send report emails. Alternatively a cron job can be scheduled to run this specific task apart from other scheduled jobs. The specific report instance and, optionally, format are specified as part of the scheduled job configuration. Refer to the Scheduled Jobs chapter for more information.
CiviReport Permissions
There are four permission specifically associated with reports:
- CiviReport: access CiviReport - user can view the CiviReport menu, but can only view reports set with the access CiviReport permission
- CiviReport: access Report Criteria - user can change report search criteria
- CiviReport: administer reserved reports - user can edit all reserved reports
- CiviReport: administer reports - user can manage report templates